

AI Prototyping in Practice: From Traffic Data to a Clickable Product Concept
We took a customer-experience case from raw traffic data to a clickable high-fidelity prototype, and let AI do the production work while the decisions stayed human.
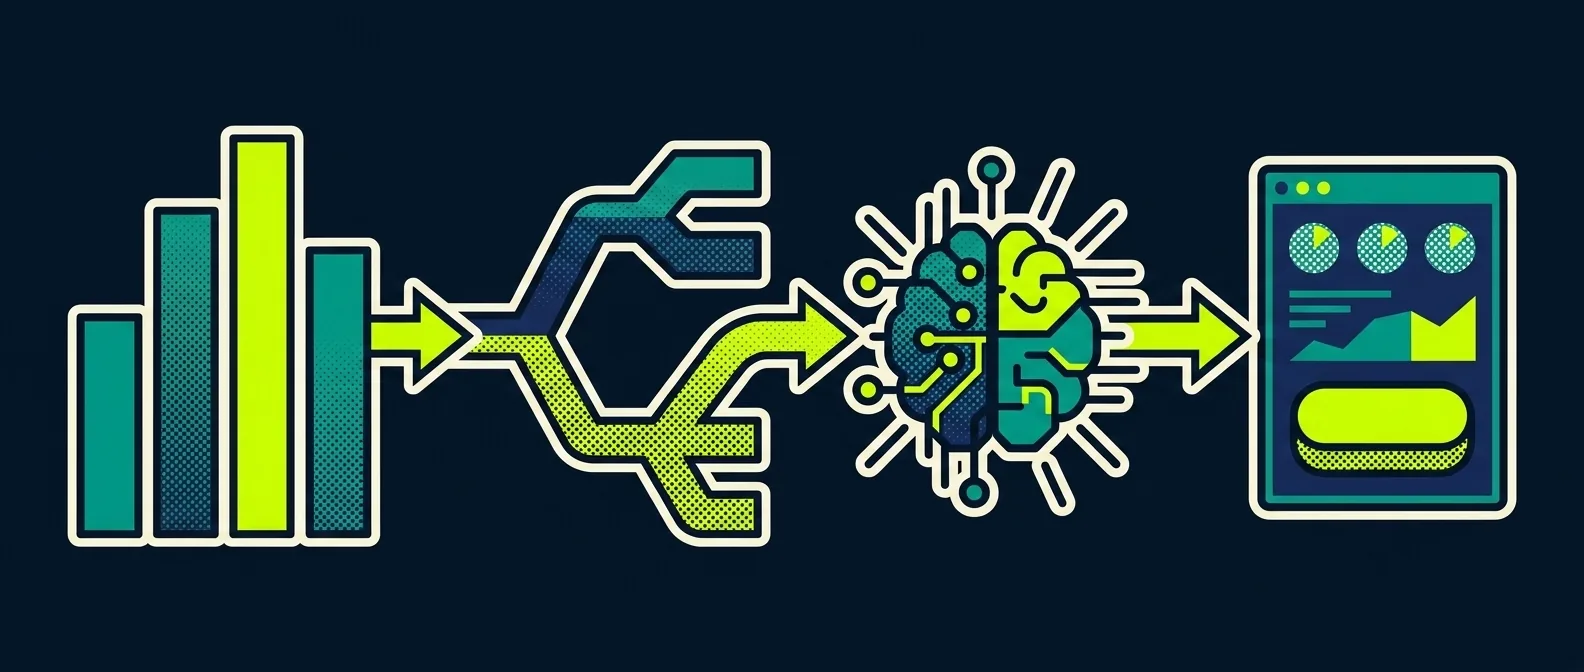
We took a customer-experience case from raw traffic data to a clickable high-fidelity prototype, and let AI do the production work while the decisions stayed human.
The case: a premium market-intelligence feature concept for LinkedIn, developed as part of a User Experience Management program. The platform was no accident. LinkedIn has become the number-one most-cited domain for professional queries across AI search platforms (Profound, 1.4M citations analyzed), appearing in 14.3 percent of ChatGPT Search responses (Semrush, 325K prompts). Design engagement for it and you are designing for the most AI-visible professional surface on the web.
The method is what transfers to your business: traffic analysis, intent mapping, concept design, AI prototyping. In that order, and fast.
You can click through the result yourself. The live prototype is embedded further down.
01How do you turn traffic data into a product concept?
You start with behavior, not opinions. Most feature ideas begin with a workshop and a whiteboard. We began with a traffic dataset: SemRush Organic Research, the top 10,000 LinkedIn URLs per country, across Germany, the UK and the US, path by path.
Path-level traffic is behavioral truth. It tells you where demand actually lands, not where a roadmap says it should. Across 30,000 URLs and roughly 31 million organic visits per month, two patterns stood out.
First: company pages are the number-one destination beyond the homepage in all three markets, 15 to 21 percent of organic traffic, remarkably consistent. People arrive to check out organizations. Second, the surprise. Long-form content behaves completely differently per market. /pulse carries 13.2 percent of US organic traffic but only 2.0 percent in Germany. A sixfold gap in share for the same feature on the same platform.
| Path | DE | UK | US |
|---|---|---|---|
| company | 559K | 1,408K | 3,329K |
| in | 543K | 620K | 2,116K |
| pulse | 56K | 221K | 2,847K |
| posts | 127K | 253K | 1,007K |
| jobs | 53K | 228K | 712K |
Read this way, a URL structure stops being an information architecture and becomes an intent map.
02From traffic to intent: three options, one decision
The premise was a classic monetization gap: user numbers rising, premium memberships declining. The question was never how to attract more users. It was how to convert attention that already exists into willingness to pay.
Our value flow: traffic analysis reveals the user intent gap, the intent gap defines the premium solution, the solution carries the monetization. We translated the traffic patterns into three user intents, each phrased as a user story, each mapped to an engagement mechanic.
- 01Search-driven intent: users hunting for professional content. Mechanic: content-based engagement loops around structured series and expert-following.
- 02Trust and validation intent: users vetting people and organizations before engaging. Company paths alone pull 3.3M monthly organic visits in the US. Mechanic: company and profile hubs as trusted sources.
- 03Decision and early-warning intent: users who need continuous, condensed signals to assess companies and markets. Mechanic: aggregated, anonymous market intelligence.
We committed to the third. Not for ease of build, but because it had the clearest link between user value and willingness to pay. A professional weighing a career move or a market entry does not need more content. They need signal.
03What is the concept? Insight Circles
Insight Circles is a premium intelligence layer: anonymous, aggregated signals from verified professionals, condensed into standardized company indicators. Attrition Pulse, Leadership Trust, Culture Health, Workload Stability. Decision-ready at a glance.
Four design decisions carry the concept.
Premium gating as the value engine. Access to the signals is coupled strictly to the paid membership. The data is the reason to subscribe, not a bonus feature on top.
Cognitive load as a CX metric. Complex text-based information becomes visual signals that can be parsed in seconds. We treated processing effort as a cost the user pays, and designed to lower it.
Re-engagement through intent triggers. Watchlists and alerts notify users the moment a tracked company’s signals shift. The next visit is not hoped for. It is triggered by relevance.
Governance by design. Anonymity thresholds, aggregation logic, and trust-and-safety mechanics are part of the architecture, not a compliance afterthought. Aggregated workforce signals only work if no individual is exposed. Credibility is the product.
04What does AI prototyping actually look like in practice?
AI prototyping means describing the intended product in natural language and letting an AI model generate the working front-end, what the industry now calls vibe-coding. This is where the process diverges from classic UX work. The path from concept to testable artifact, historically days in a design tool, ran through prompts.
This is not a fringe practice anymore. Cursor’s Developer Habits Report (Spring 2026) measures the shift across its user base: coding output per developer has roughly doubled year over year, and the share of AI-generated code surviving review keeps rising. The speed we experienced is the industry baseline now, not a party trick.
Our tool was Claude. Here is the honest version, because the marketing version, one prompt and a finished product, is not what happened. The build ran in layers, each one earned through iteration.
One prompt gets you a picture. Iteration gets you a product.
Before any of that, a low-fidelity wireframe set fixed structure and flow, prompted from the concept and the four design decisions. That AI wireframing stage is where the thinking happens. The Hi-Fi stage is where stakeholders stop imagining and start reacting. AI collapses what used to be days of production into working sessions, but it does not replace the thinking. A fast wrong prototype is still wrong.
The division of labor that worked: humans own the intent mapping, the concept decision, and the judgment on what the prototype must prove. AI owns production, layout, states, visual consistency, iteration speed.
05Try it yourself
The high-fidelity prototype is live below. Click through the Insight Circles concept: the signal dashboard, the company view, the watchlist mechanic.
It is a concept study, not a LinkedIn product. That distinction matters. Everything above is an independent design exercise on public traffic data, not insider knowledge of anyone’s roadmap.
06Where does AI stop and judgment start?
AI stops at production and judgment starts at everything upstream of it. The method is the deliverable. Any company with digital touchpoints can run this loop: pull behavioral data on where demand actually lands, map it to intents, design against the intent with the clearest value-to-revenue link, and prototype with AI at production speed while keeping the decisions human.
Harvard Business Review made the same argument, as it happens on the day this page went live: research across management and cognitive science shows that uncritically accepted AI output erodes the very judgment that creates value, and the remedy is designing workflows that keep humans reasoning instead of offloading it (HBR, July 2026). Our loop is that design in practice. The analysis stays human because the analysis is the product.
The expensive part of product work used to be making ideas tangible. That cost has collapsed. What is left, and what separates a usable concept from a fast-rendered wrong one, is the analysis and the judgment in front of it.
What your own traffic data says about what your customers actually want, and how fast a clickable concept can sit in front of your stakeholders: that is a conversation worth having.