

Luxury brand tiers, decoded from price point to construction
Premium and luxury are different companies, different price architectures and different construction methods. Here is how the market actually classifies them, and what each part changes about how you plan.
Premium and luxury get used as if they were intensity settings on the same dial. They are not. They describe different companies, different price architectures and different construction methods, and the industry itself splits them cleanly enough that the major analyst houses classify groups one way or the other.
We have mapped this market in our own research and worked inside it in corporate development. Here is the classification as the industry actually uses it, and what each part of it changes about how you plan.
01What is the difference between premium and luxury?
Premium and luxury first diverge as a pattern of corporate specialisation: the analyst houses place groups on one side or the other, and that sorting follows the origins of the brands each group owns more than it follows current positioning.
Two patterns show up when you look at how the analyst houses sort the major groups. Luxury concentrates in France, Italy and Switzerland. Premium is where Germany, the United Kingdom and the United States sit. That is not an accident of taste. It follows the industrial history of each country: where a group’s oldest brands grew out of couture, leather workshops or watchmaking, it tends to be classified luxury, and where they grew out of apparel manufacturing at scale, premium.
And the group label does not travel to every brand underneath it. Large luxury groups hold portfolios spanning several price tiers, including brands well below their own classification. The reverse also happens: premium groups own individual lines that sit above their group label.
Group classification tells you where a company's centre of gravity is. It does not tell you what price tier a given product occupies.
For planning, that is the whole point. Group classification tells you where a company’s centre of gravity is. It does not tell you what price tier a given product occupies, and it is the product tier that drives the assortment.
02What are the three luxury brand tiers?
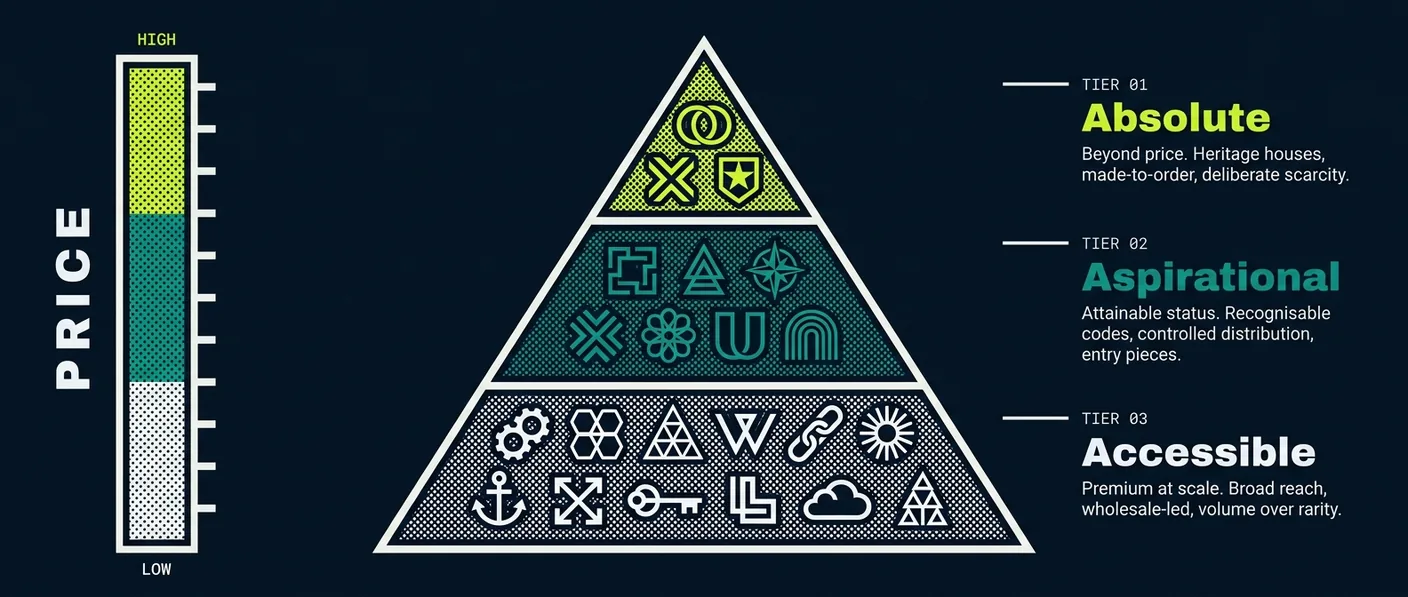
The three luxury brand tiers are the AAA model, for Absolute, Aspirational and Accessible (D’Arpizio, 2011). It segments products, by price point.
Absolute. Beyond price. Heritage houses, made to order, deliberate scarcity. The attributes recorded in the original framework are elitism, icon status, heritage and uniqueness. Roughly 13% of the market by the 2010 estimate.
Aspirational. Attainable status. Recognisable codes, controlled distribution, entry pieces. Attributes: aspiration, recognisability, distinctiveness. Roughly 23%.
Accessible. Premium at scale. Broad reach, wholesale-led, volume over rarity. Attributes: affordability, membership, status. Roughly 65%.
Those shares are a 2010 estimate and should be read as structure rather than as current numbers.
The tiers are not marketing language. They map to how the product is physically made. Take one product group, a men’s suit, at three price points observed in 2021:
- Absolute, around 5,250 EUR. Traditional construction, full canvas. Made in Italy.
- Aspirational, around 2,500 EUR. Semi-traditional construction, half canvas. Made in Italy.
- Accessible, around 799 EUR. Industrial construction, fused. Made internationally.
Full canvas means the interlining is stitched to the fabric and the garment moulds to the wearer over time. Half canvas does it partially. Fused means the interlining is glued. Each step down is a manufacturing decision with a cost consequence, and that is what the tier is actually measuring. A factor of six and a half separates the two ends of that range, and almost all of it is method and origin rather than markup.
Price points are 2021 and will have moved. The construction hierarchy has not.
Consumers agree, and there is now a number for it. Asked in 2026 to rank the drivers behind their last luxury purchase, 10,000 respondents put design first and craftsmanship second. Logo visibility ranked last (BCG and Altagamma, 2026). What the tier measures is what the buyer is actually buying, which is why a tier claim the construction does not support tends to fail in the market rather than in the brief.
Where that tier then gets sold is a separate decision, and the channel it lands in carries its own margin. We trace that end to end in the merchandise planning chain.
03Aspirational tier or aspirational consumers? Which one does the data mean?
The industry uses the same three words for two different cuts of the market, and it is worth being deliberate about which one you are reading.
The AAA model above segments products by price point. That is the aspirational tier. The consumer pyramid used in the annual studies segments buyers by how much they spend on luxury in a year, and calls the large lower group aspirational consumers. Both usages are correct and both are standard. They are not the same object.
They relate, without mapping one to one. A single buyer moves across price tiers inside one purchase trip: a wallet from one tier, a coat from another. And an accessible-tier product is bought by consumers at every spend level, including the highest. Products sit in tiers. People sit in spend groups.
For planning that separation is the whole game. Your assortment is built in price tiers. Your demand is generated by consumers. When a study reports that aspirational consumers pulled back, that is a demand signal, not an instruction to restructure the aspirational tier of your range.
04Which part of the market actually wobbled?
The part of the market that wobbled is the aspirational base, and the framework predicted its own stress test.
The fragility was flagged long before it showed up: entry-to-luxury tiers are the least resilient to external shocks, and the aspirational base they rest on has never been stable. That was clear well before the financial crisis.
It arrived in 2024. Personal luxury goods contracted, the first negative growth outside the Covid period since 2008, and the retreat of aspirational consumers drove it.
Then it stopped. By 2026 the same study series reports that group stabilising rather than continuing to fall: aspirational consumers held at 55% of market spend across both 2024 and 2025, and their forward appetite improved more than any other group, up 7 percentage points year on year (BCG and Altagamma, 2026).
Two things follow. The part of the market that carries the volume carries the volatility, and that was flagged long before 2024 rather than discovered in it, which makes it structural rather than a one-off. And a group stabilising at a lower share is a different planning problem from one in freefall: the first calls for a rebased plan, the second calls for a hedge.
05What are the market’s product categories?
The personal premium and luxury goods market divides into four categories: beauty, hard luxury (watches and jewellery), apparel, and accessories such as shoes and leather goods (Thieme, 2017b).
By the 2020 estimate the split was accessories 36%, beauty 22%, hard luxury 21% and apparel 21% (D’Arpizio et al., 2021).
Two things are worth sitting with there.
Apparel is not the largest category. It is the smallest, level with hard luxury, and accessories carry more than any other category by a wide margin. Anyone reading this from an apparel business is looking at roughly a fifth of the market they are nominally in. That is why so many fashion houses defend their leather goods lines more aggressively than their ready-to-wear. The bags are not an accessory to the business, they are most of it.
And beauty, at 22%, is larger than apparel, while almost no fashion house manufactures it. Fashion brands reach that category through licensing, which is why licence income is a structural part of premium and luxury economics rather than a side note.
06What do the market’s growth phases tell a planner?
Thirty years of this market have been mapped into named phases, each with its own driver and its own compound growth rate. Read as a list of dates it is history. Read as a sequence of planning environments it is a warning about which baseline you calibrated on.
Phase framework: D'Arpizio (2017) and D'Arpizio and Levato (2020). Current-period figures: BCG and Altagamma, True-Luxury Global Consumer Insights, 12th edition, 2026. Market size and current outlook: Bain and Altagamma, 2025. Phase names and rates are theirs; the planning consequences are ours.
The pattern underneath is what matters more than any single rate. This is a cyclical industry whose demand tracks the wider economy, and whose standard response to a volume shock is to raise prices rather than cut them. It has done that twice in twenty years. Plan the mix for that behaviour, not just the number.
07Where does that leave our own forecast?
Our own earlier modelling put the market at roughly 330 to 370 billion EUR by 2025. The reported figures are 364 billion EUR in 2024 and a forecast of 358 billion for 2025 (Bain and Altagamma, 2025). The band held.
The reasoning behind it did not, and that is the more interesting result. The forecast assumed continued growth driven by digital channel expansion and Chinese demand. What produced the number was a contraction followed by stabilisation, with the active client base falling to roughly 330 million in 2025 from 400 million in 2022.
Right number, wrong mechanism. A market can hit its forecast value while losing a fifth of its buyers.
Right number, wrong mechanism. A market can hit its forecast value while losing a fifth of its buyers, and a plan built on the headline figure alone will be built for the wrong customer.
08What does this mean if you are planning against this market?
Three things we would take into any planning conversation.
Tier is a manufacturing decision before it is a positioning decision. If the construction method does not support the tier, the price architecture will not hold, and the assortment plan built on it inherits the problem.
Category weighting matters more than category prestige. Apparel is the smallest of the four categories, and businesses that plan as though it is the centre of the market misallocate open-to-buy.
And read the aspirational label carefully every time you meet it. Your assortment is planned in price tiers. Your demand comes from consumers. The 2024 contraction was a consumer event that a number of people read as a product-tier problem, and rebuilt their ranges accordingly.
If you are mapping tier strategy, category mix or channel architecture against this market, that is the work we do. Thirty minutes, and we will sketch where your assumptions and the current data disagree.
Recommended reading
The current studies are published openly by the houses that produce them. If you are building a plan, read theirs.
- Boston Consulting Group and Fondazione Altagamma (2026): True-Luxury Global Consumer Insights, 12th edition. Milan, July 2026.
- Bain & Company and Fondazione Altagamma (2025): Luxury Goods Worldwide Market Study, 24th edition.
- Boston Consulting Group (2019): True-Luxury Global Consumer Insights, 6th edition. Milan.
- Deloitte (2020): Global Powers of Luxury Goods 2020. The new age of fashion and luxury. Deloitte Touche Tohmatsu Limited. Current editions: Global Powers of Luxury Goods series.
- D’Arpizio, C. (2017): Worldwide Luxury Market Monitor. Millennial State of Mind. Bain & Company, Inc.
- D’Arpizio, C.; Levato, F. (2020): Luxury Goods Worldwide Market Study, Fall-Winter 2020. Bain & Company, Inc.
- D’Arpizio, C.; Levato, F.; Prete, F.; Gault, C.; Montgolfier de, J. (2021): The Future of Luxury: Bouncing Back from Covid-19. Bain & Company, Inc.
- D’Arpizio, C. (2011): Altagamma 2011 Worldwide Markets Monitor. Bain & Company, Inc., Milan.
- Thieme, Werner M. (2017b): Der weltweite Markt für persönliche Luxusgüter. In: Werner M. Thieme (Hg.): Luxusmarkenmanagement. Wiesbaden: Springer Fachmedien Wiesbaden, S. 137 to 146.
- Stępień, Beata (2021): The Value of Luxury. Cham: Springer International Publishing.